Using Synthetic Aperture Radar (SAR) to Keep the Public Informed

A crucial part of keeping the public safe and secure is by providing information to enable people to make safer and smarter decisions. For example, a business owner must decide when to stall or resume standard operating procedures or a consumer must decide when it's safe to visit a local grocery store.
It is difficult to know how, and to what extent, COVID-19 is affecting global activity. By leveraging years of archived and contemporary satellite collections, Ursa is monitoring the economic and socioeconomic impacts of the COVID-19 pandemic locally, regionally, and globally. Our expertise in satellite imagery analytics and data fusion enables us to derive timely insights from detection of geospatial activity. With these insights, Ursa creates a detailed analysis of current activity to identify change patterns and alert the public of fluctuations in activity.
Specifically, Ursa utilizes synthetic aperture radar (SAR) technology to identify activity levels at key locations all over the world. SAR-based satellites are not hindered by clouds or time of day, allowing for a consistent view of the area of interest. By identifying trends in activity levels across many similar types of structures, we can draw conclusions on operational status as affected by COVID-19.
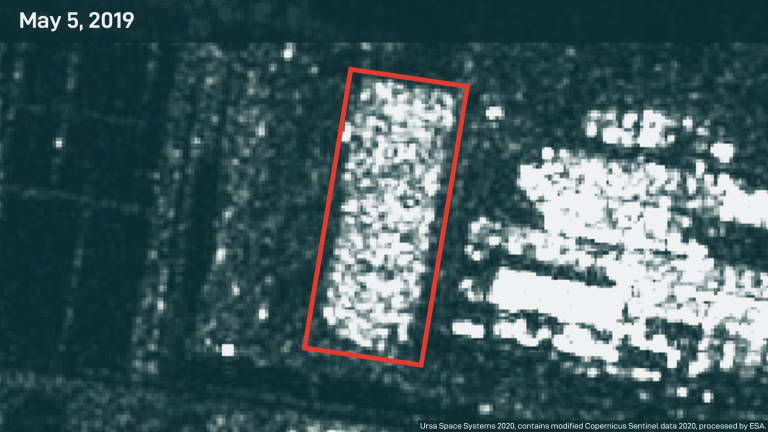
As China starts to get back to work after the coronavirus outbreak crippled its economy, all eyes are on the recovery. The status of car manufacturing plants in China provides insight into China’s stability and resumption of its economy as the negative effects of COVID-19 may be slowing. By using SAR to observe the FAW-Volkswagen Manufacturing Plant (Tianjin, China) over a 20-month time series, we compare prior typical activity levels to recent levels. In this case, SAR is an indicator of workers’ cars in parking lots at the facility or cars produced by the facility to be shipped or sold.
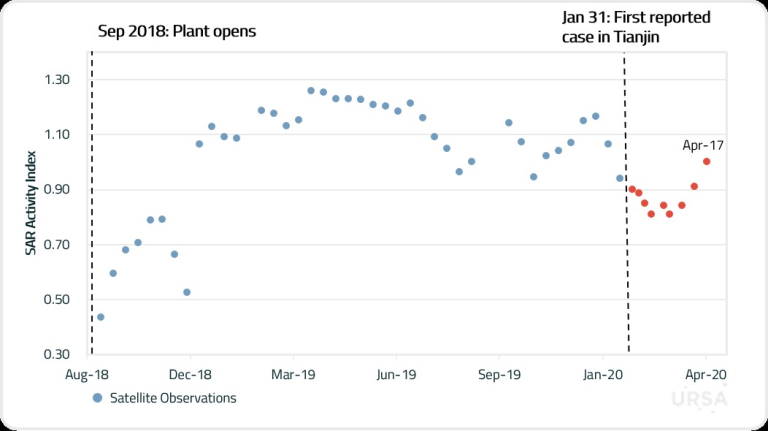
Figure 1 shows our “SAR Activity Index”, a value generated by comparing each level of activity to the average level over the full 20-month period. Results above 1 are greater than the average energy total in this period, results below 1 are lower than the average energy total in this period. As shown by the figure, operations had been quite steady since the plant fully opened, but recently showed a notable decrease, followed by a more recent uptick. From these observations, we may suggest that the facility was closer to full operations in mid-April as compared to the weeks prior, retracing close to pre-COVID production levels.
Ursa publishes additional findings in a public facing dashboard, allowing users to gather more pertinent information on economic activity. For example, Ursa is currently investigating activity around the construction and opening of African temporary field hospitals and food/agriculture imports. Such research may inform decisions, hopefully improving and strengthening public health during the COVID-19 epidemic. Visit our free, public COVID-19 Dashboard for more insights and updates and feel free to let us know what you’re interested in analyzing further in relation to the global impacts of COVID-19.